What to Expect
At Insight Out Analytics, we turn raw data into clear, interactive insights with custom Power BI dashboards. From marketing performance to employee productivity to sales and inventory management, we design solutions that answer the real questions driving your business:
Who are our best customers? Where are we losing money? How can we plan smarter?
The use cases below showcase how we approach different challenges—from identifying preferred customers in global campaigns, to predictive analysis, to optimizing profits and inventory in retail chains. Each example highlights the kind of clarity and decision-making power we bring to our clients.
See for yourself
Click on any dashboard to explore an interactive version, and see firsthand how data can be transformed into actionable strategy.
Marketing Performance
Challenge
a luxury lifestyle brand selling wine, gourmet meats, artisan sweets, and investment-grade gold, launched a global marketing campaign across multiple countries and continents. Despite strong sales, leadership struggled to identify who their most valuable customers were and how preferences differed across regions. Campaign results varied by country, but there was no clear way to compare product performance or customer behavior. The team lacked visibility into which products appealed to high-value buyers, how demographics shaped spending patterns, and which markets held the greatest long-term growth potential. Without a consolidated view, the company found it difficult to focus efforts on nurturing its preferred customers and tailoring strategies to maximize loyalty and profitability. They needed a solution to bring clarity and guide marketing decisions around customer value.
Solution
We developed a Power BI marketing performance dashboard that integrates campaign spend, sales, and customer data across all regions. The dashboard tracks income vs. spend, showing where marketing budgets are over or underperforming. It highlights product sales by country, identifies conversion rates between website visits and purchases, and compares average customer spend across markets. Monthly trends reveal seasonal shifts in demand, while demographic insights help refine targeting strategies. With this solution, they gained real-time visibility into campaign effectiveness, optimized regional marketing spend, and aligned strategy with actual customer behavior. The dashboard turned complex, fragmented data into actionable insights, allowing leadership to make smarter, faster, and more profitable decisions.
HR & Employee Performance
Challenge
A multinational corporation employing over 50,000 people faced difficulties in gaining a clear view of its workforce. While the company collected large volumes of HR and performance data, it remained siloed across different systems, making it hard to draw meaningful insights. Leadership struggled to understand why some employees resigned while others stayed, what factors drove productivity, and how to fairly evaluate performance across departments. HR teams lacked visibility into demographics, education, and work habits that influenced long-term success, while managers needed better tools to identify employees at risk of burnout or disengagement. Without a unified approach, the company risked losing top talent, misallocating training budgets, and making decisions based on incomplete information. A comprehensive dashboard was needed to bring together workforce data and uncover actionable insights.
Solution
We built a HR & Employee Performance Dashboard that transforms thousands of rows of workforce data into clear, actionable insights. The dashboard gives HR leaders and managers a unified view of hiring and turnover trends, showing monthly patterns of employees hired and resigned, with clear distinctions between voluntary quits and terminations. It also connects performance scores with satisfaction levels across departments, helping identify teams at risk of disengagement or burnout. Salary analysis provides transparency by showing departmental averages alongside minimum and maximum pay ranges, while demographic insights—such as gender identity and average employee age—support workforce planning and diversity initiatives. Productivity measures, including hours worked per week relative to team size and overtime, highlight workload balance, while promotion data tied to education level helps evaluate career development opportunities. By consolidating these perspectives, the dashboard enables the company to predict churn, optimize compensation strategies, and create a more engaged, high-performing workforce.
Inventory Management
Challenge
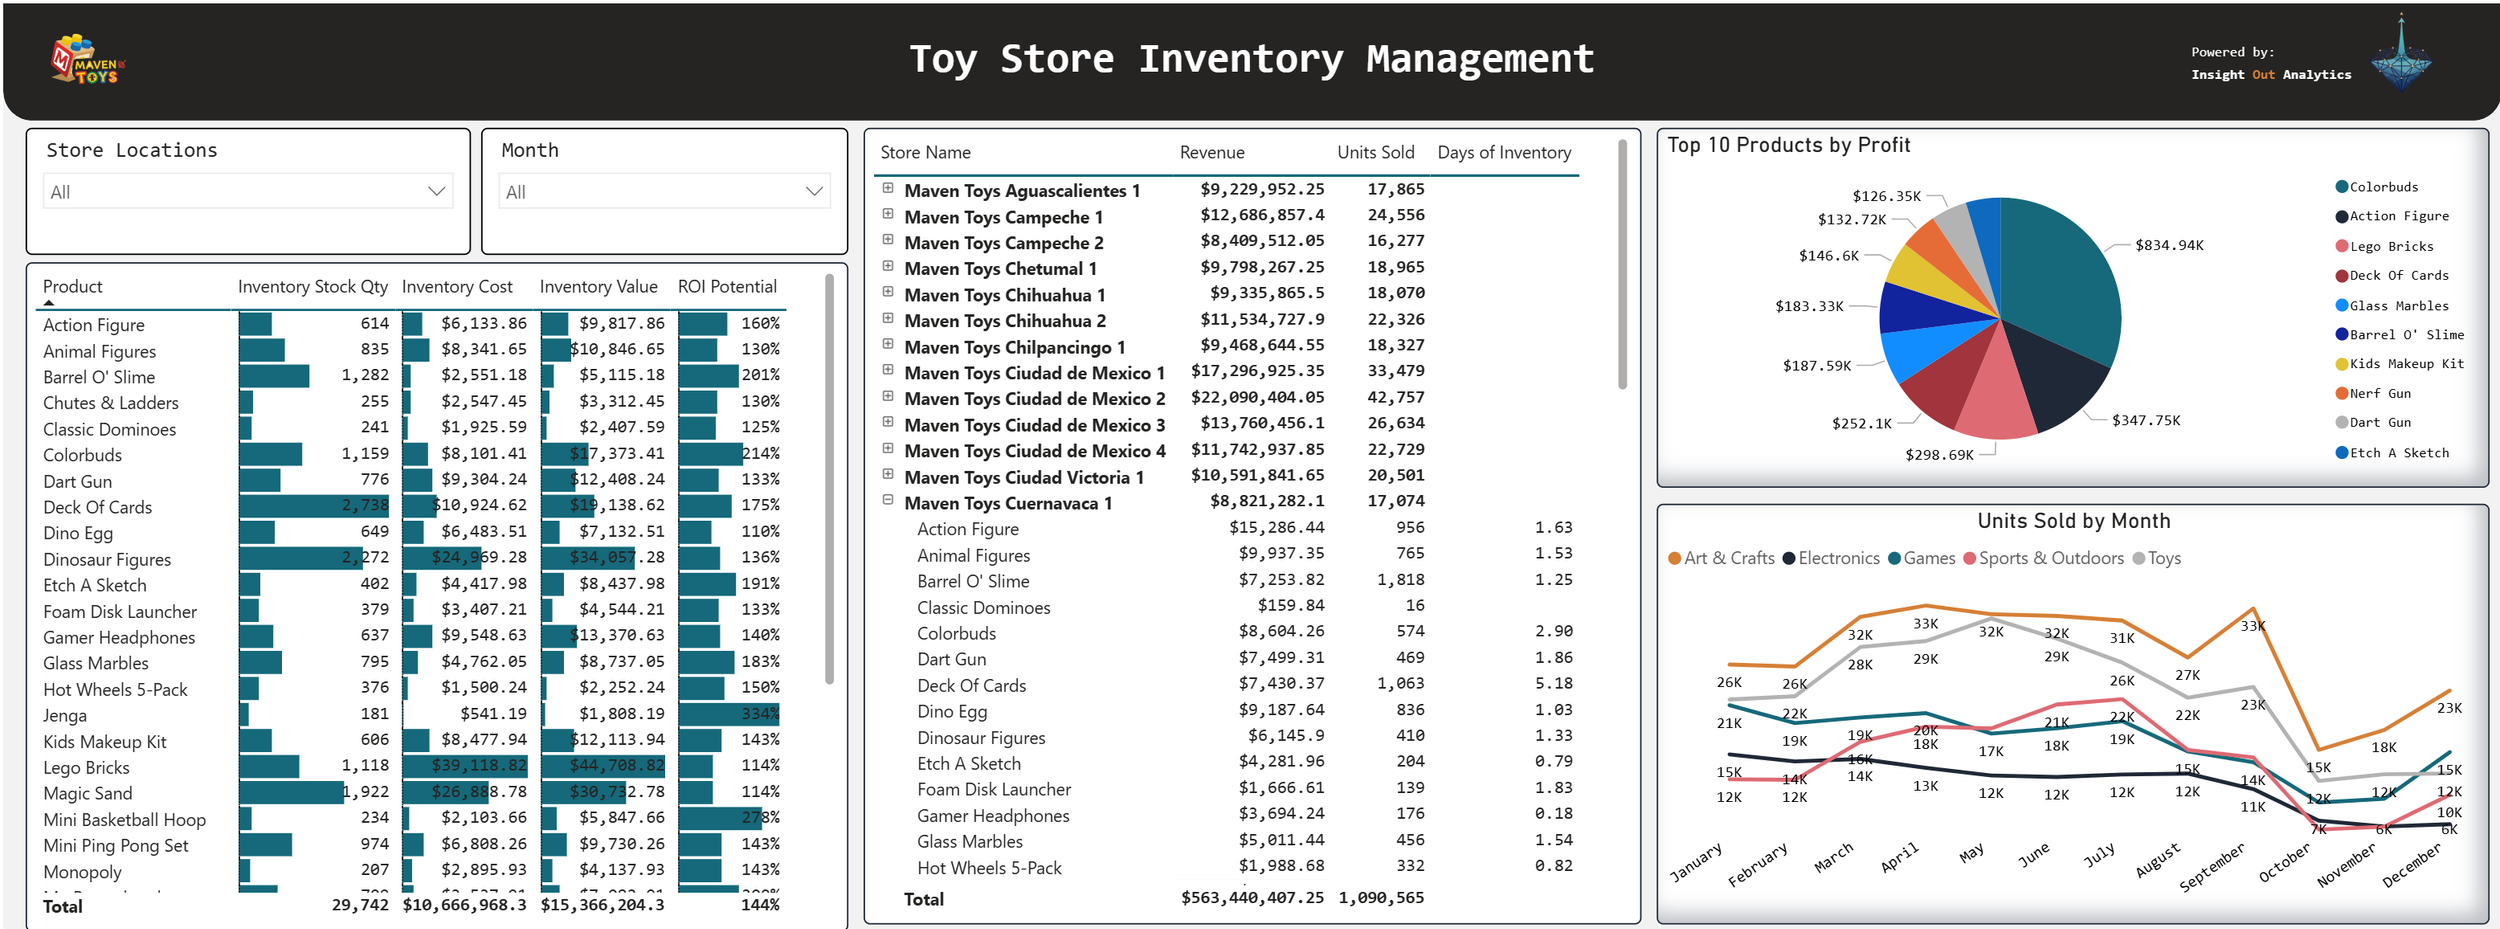
A growing toy store chain in Mexico, with multiple locations across the country, was struggling to manage sales and inventory effectively. While the company tracked daily transactions, product categories, and stock levels, the data was scattered across different systems and not easily analyzed. Store managers couldn’t see which products and categories were driving the most profit, or whether the most profitable items were consistent across locations. Seasonal sales patterns—especially around holidays—were hard to identify without digging through raw spreadsheets. The company also faced frequent stockouts at certain stores, leading to lost sales, while at the same time holding too much capital in slow-moving inventory. Leadership needed a solution that could reveal where money was being made, where it was being lost, and how long current inventory could sustain demand.
Solution
We established a Sales & Inventory Dashboard that brings together product, store, and transaction data into one interactive view. The dashboard highlights inventory stock levels, costs, and total value, giving clear visibility into how much capital is tied up and how efficiently it’s moving. It also calculates ROI potential by product & category, revealing which toys deliver the strongest margins. Store-level insights show revenue and units sold by location, helping identify regional strengths and weaknesses. Seasonal sales patterns are uncovered by analyzing units sold by month, while profitability is tracked through the top 10 earning products. Predictive calculations estimate the number of days of inventory remaining, helping managers prevent both stockouts and overstock. With these insights, the toy store chain gained a data-driven way to optimize product assortment, reduce lost sales, and ensure inventory investments are working harder for the business.


